In this tutorial, you will learn how to display data in graphical form using the Chart Helper in ASP.NET MVC. The “Chart Helper” can create chart images of different types with many formatting options and labels. It can create standard charts like area charts, bar charts, column charts, line charts, and pie charts, along with more specialized charts like stock charts. The data you display in a chart can be from an array, from the results returned from a database, or from data that’s in an XML file.

Step 1
Lets create new ASP.NET MVC application and name it to “MvcChartDemo” then add the below ProductSales model and DbContext class inside Models folder.
public class ProductSales
{
public int Id { get; set; }
public string Name { get; set; }
public int Sales { get; set; }
}
public class SalesContext : DbContext
{
public DbSet ProductSales { get; set; }
}
Step 2
Next, add the below connectionStrings in Web.config file:
<connectionStrings>
<add name="SalesContext" providerName="System.Data.SqlClient" connectionString="Data Source=./SQLExpress;Initial Catalog=Test;Integrated Security=SSPI;" />
</connectionStrings>
Step 3
Next, create HomeController and add the Index action method. Also, create the /Views/Home/Index.cshtml view and replace the content with the following code:
Index.cshtml
@model IEnumerable<MvcChartDemo.Models.ProductSales>
@{
ViewBag.Title = "Chart Helper Demo";
}
<h2>Chart Helper Demo</h2>
@{
var key = new Chart(width: 600, height: 400)
.AddTitle("Product Sales")
.AddSeries("Default",
xValue: Model, xField: "Name",
yValues: Model, yFields: "Sales")
.Write();
}
Here, we create the Chart using the following Chart Helpers method.
@{
var key = new Chart(width: 600, height: 400)
.AddTitle("Product Sales")
.AddSeries("Default",
xValue: Model, xField: "Name",
yValues: Model, yFields: "Sales")
.Write();
}
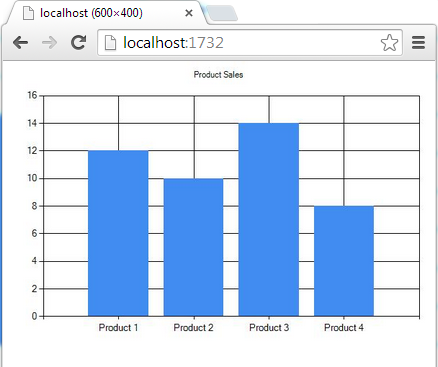
The code first creates a new chart and sets its width and height. You specify the chart title by using the AddTitle method. To add data, you use the AddSeries method. In this example, you use the name, xValue, and yValues parameters of the AddSeries method. The name parameter is displayed in the chart legend. The xValue parameter contains an array of data that is displayed along the horizontal axis of the chart. The yValues parameter contains an array of data this is used to plot the vertical points of the chart.
The Write method actually renders the chart. In this case, because you did not specify a chart type, the Chart helper renders its default chart, which is a column chart.
Now, run the application and you will see below output:
Step 4
You can change the Chart Type by defines chartType parameter of chart inside AddSeries method:
@{
var key = new Chart(width: 600, height: 400)
.AddTitle("Product Sales")
.AddSeries(chartType: "Pie",
xValue: Model, xField: "Name",
yValues: Model, yFields: "Sales")
.Write();
}
HostForLIFE.eu ASP.NET MVC 6 Hosting
HostForLIFE.eu is European Windows Hosting Provider which focuses on Windows Platform only. We deliver on-demand hosting solutions including Shared hosting, Reseller Hosting, Cloud Hosting, Dedicated Servers, and IT as a Service for companies of all sizes. We have customers from around the globe, spread across every continent. We serve the hosting needs of the business and professional, government and nonprofit, entertainment and personal use market segments.